
This page is an attempt to bring an exciting new research topic to the operational
environment. If it is your first time here, or if you are confused about something, you may
want to take the time to read
about the products on this page and the data and methods used to create them.

| Mean | F0 | F6 | F12 | F18 |
|---|---|---|---|---|
| F24 | F30 | F36 | F42 | F48 |
| F0-F48 |
| Upper PV Perturbation | ||||
|---|---|---|---|---|
| F0 | F6 | F12 | F18 | F24 |
| F30 | F36 | F42 | F48 | F0-F48 |
| Interior PV Perturbation | ||||
| F0 | F6 | F12 | F18 | F24 |
| F30 | F36 | F42 | F48 | F0-F48 |
| Surface Theta Perturbation | ||||
| F0 | F6 | F12 | F18 | F24 |
| F30 | F36 | F42 | F48 | F0-F48 |
For more analysis and forecast products from today's ETA model run see the the AOS Department's ETA model products page.
For more analysis and forecast products from today's UWNMS model run see the UW-NMS site or the AOS Department's 4-model comparison page.
Experimental Products (for the .meteor domain only)
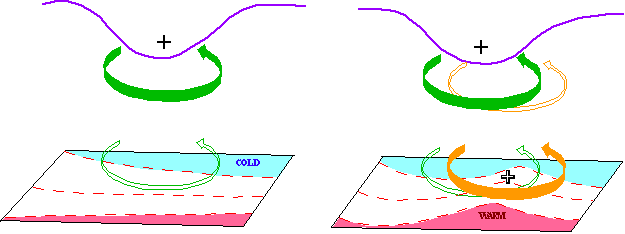
Figure:Hoskins. B. J., M. E. McIntyre, and A. W. Robertson, 1985:
On the use and significance of isentropic potential vorticity maps.
Quart. J. Roy. Meteor. Soc., 111, 877-946.

 I am looking for feedback on this page so please write to me!
There have been visitors to this page since 6/20/97.
Sebastien Korner(korner@meteor.wisc.edu)© Copyright 1998 Sebastien Korner
This work was supported by the National Science Foundation, Division of
Atmospheric Sciences, Grant Number ATM-9505849.